
Start with the plain answer, because millions of people are asking the question. UK taxes are heading for a post-war high while public services get worse because the state's balance sheet flipped. In 1970 the British government held net wealth worth about a quarter of national income: the hospitals, the schools, a large share of the housing. By March 2026, public sector net worth stood at minus £695.7 billion on the ONS measure. A government that owns its assets provides services cheaply. A government that owns nothing rents its assets back and pays interest on its debts, £97.6 billion of interest in the last financial year alone. So a growing share of what you pay in tax no longer buys teachers or nurses. It services the past. Record taxes and declining services are not a paradox. They are the same fact, seen from two sides.
The question has been pushed into the mainstream by Gary Stevenson, the former Citibank trader whose Gary's Economics channel has made the wealth distribution a household argument, and whose latest video makes exactly this case. I checked his claims against the primary sources before writing this. His direction survives contact with the data almost everywhere; some of his magnitudes do not, and I will say where. But the story the official numbers tell is stark enough without exaggeration.
The number nobody campaigns on
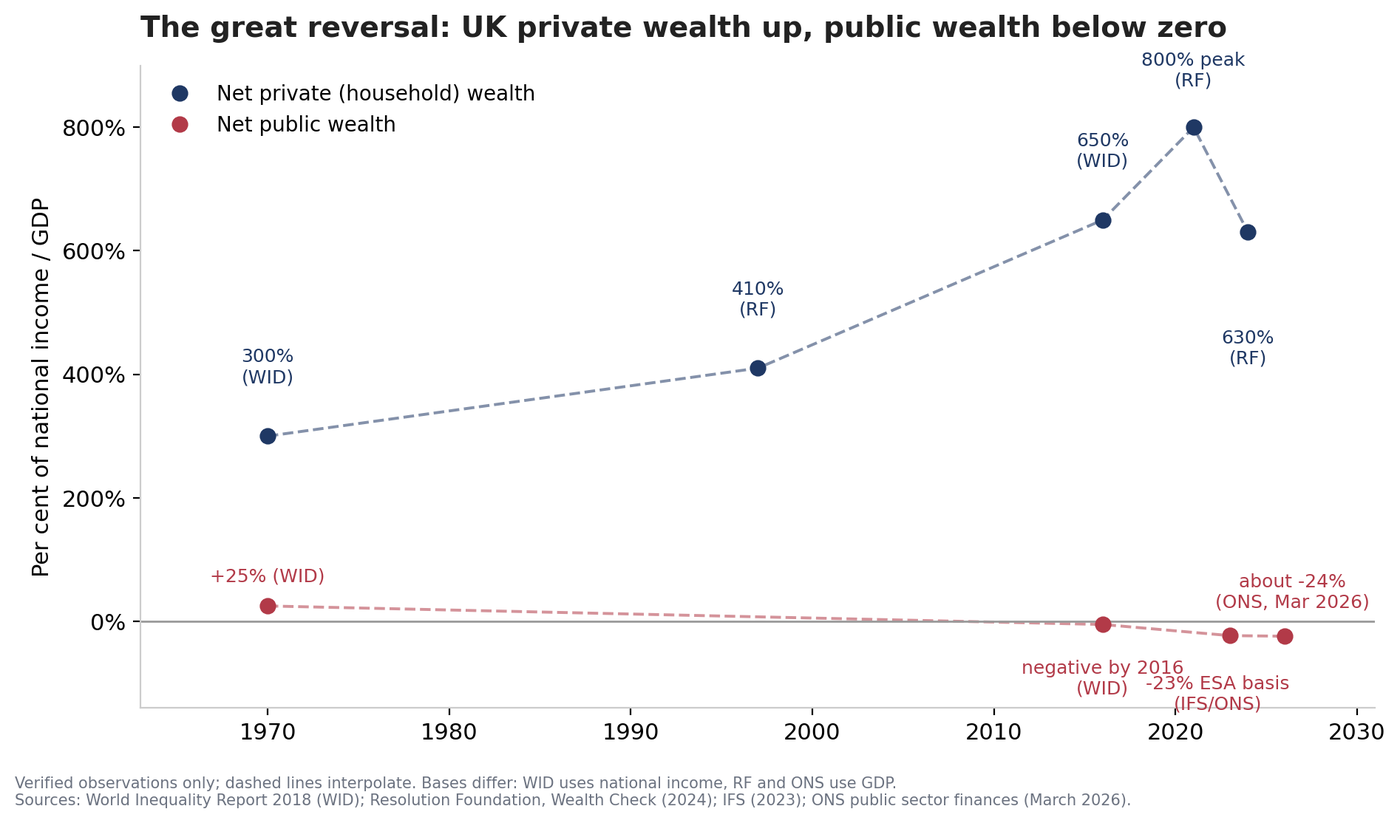
Every fiscal debate in Britain is about the deficit and the debt. Almost none is about net worth: what the state owns minus what it owes. Yet that number is the one that explains the country's predicament. The Office for National Statistics puts public sector net worth at minus £695.7 billion at the end of March 2026, roughly minus 24 per cent of GDP. On the IMF's fuller accounting framework, which the Institute for Fiscal Studies has examined, the position is nearer minus 60 per cent of GDP, with the UK holding the second-lowest public assets in the G7 and the fifth-highest liabilities. The long series compiled by the World Inequality Database, the data behind Gabriel Zucman's work, shows UK net public wealth at about plus 25 per cent of national income in 1970, turning negative by 2016.
Stevenson rounds this story to "plus 100 per cent to minus 100 per cent." The best-documented series do not support magnitudes that large, and I think the argument is stronger without them. A state that has gone from owning a quarter of a year's national income to owing the equivalent of a quarter of one is a dramatic enough reversal to explain everything that follows.
Where the wealth went
Public wealth did not evaporate. Most of it moved, through two front doors and one back door.
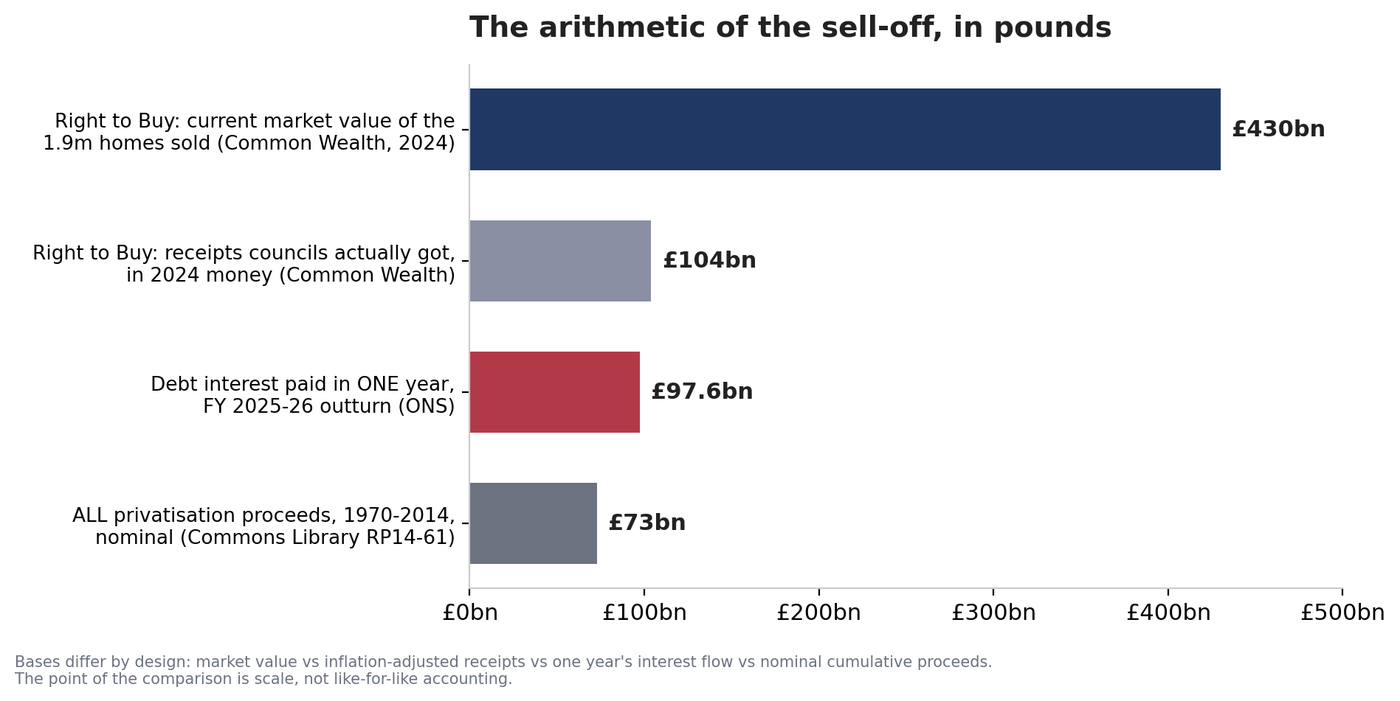
The first front door was Right to Buy. Between 1980-81 and March 2024, England sold 1.9 million council homes at an average discount of 44 to 45 per cent of market value. Councils received £51 billion in nominal terms, about £104 billion in 2024 money, for homes now worth roughly £430 billion, on Common Wealth's analysis of the official data. The discount alone, the part simply given away, is worth about £194 billion today. And the wealth did not stay with the families the policy meant to help: an estimated 41 per cent of those homes, about 780,000 of them, are now owned by private landlords.
The second front door was privatisation. British Telecom, British Gas, electricity, water, rail: the entire programme from 1970 to 2014 raised about £73 billion in nominal terms, on the House of Commons Library's figures, with the National Audit Office repeatedly finding sales underpriced. Hold that number against the back door: debt interest. The state paid £97.6 billion in central government debt interest in the financial year to March 2026. Britain now pays out more in interest every single year than the entire forty-four-year privatisation programme brought in.
The mirror image
While the public balance sheet sank, the private one soared. Household wealth in Great Britain rose from about 300 per cent of GDP in the 1980s to a peak near 800 per cent in 2021, easing to roughly 630 per cent by early 2024, on the Resolution Foundation's figures. The rise since 1997 alone is £9.7 trillion. Here is the detail that changes the politics: the Resolution Foundation calculates that without the passive capital gains generated by four decades of falling interest rates, household wealth would be about £4.7 trillion lower. Most of the boom was never earned or saved. It was revaluation, and it landed on whoever already held assets.
Which was not everyone. The wealth Gini coefficient in Great Britain is 0.59, against roughly 0.35 for income. Entering the wealthiest tenth of households required £1.2 million; the least wealthy tenth held £16,500 or less. The gap between the top tenth and the median is now £1.3 million per adult. And while private wealth roughly doubled relative to national income, the revenue raised from taxing wealth barely moved: about 3 per cent of GDP, against 2.5 per cent in 1972. Britain taxes work at a post-war high, 37.7 per cent of GDP by 2027-28 on the OBR's forecast, while taxing a doubled wealth stock at 1970s rates. That is a choice, even if nobody remembers making it.
What the sale got right
Honesty requires the other side of the ledger. The nationalised industries of the 1970s were often run badly: underinvestment, political pricing, repeated bailouts. Privatisation brought real productivity gains where genuine competition arrived, in telecoms above all. Right to Buy gave hundreds of thousands of working families their first appreciating asset, which is exactly the kind of wealth-building this article argues families need. The sale was not looting; much of it was a defensible answer to real failures.
The failure was what came after. The efficiency gains came mostly from competition and regulation, which never required selling the freehold; where competition never arrived, in water above all, private ownership delivered gearing and dividends rather than investment. Councils were barred from replacing the homes they sold. And the proceeds were spent as ordinary revenue rather than reinvested. Norway made the opposite choice with its oil money and now owns a fund that passed 20,000 billion kroner in 2024. Same era, same windfalls, opposite balance sheets.
A balance sheet is a wall
Why does any of this matter beyond accounting? Because wealth carries passive income, and its absence carries a passive outflow. A government with net assets meets a crisis by drawing on them. A government with net liabilities meets the same crisis by borrowing at whatever price the market sets on the worst possible day. Singapore drew about S$40 billion from its past reserves to fund its COVID response, no borrowing, no market permission required, and investment returns fund about a fifth of its entire budget every year. Britain funded furlough and the Energy Price Guarantee wholly with debt, and the bill arrived: 30-year gilt yields hit their highest since 1998 this year, and the OBR calculates that a single percentage point on gilt rates adds £9.6 billion a year to the interest bill.
The next decades will test this more, not less. Pandemics, energy shocks, climate losses, rearmament, the labour-market turbulence of AI: these are exactly the moments a state must stand between events and its citizens, especially the households with no buffer of their own. A family facing a riskier world saves more. I hold that the same logic applies to a country, and that public net worth is best understood not as ideology but as insurance: the common good's emergency fund, the wall between ordinary families and the next external shock. Britain spent forty years selling the wall, brick by brick, and is now surprised by the wind.
Rebuilding the wall
Three routes exist, and they are not rivals so much as ingredients.
The first is taxing the stock of wealth. The instruments are costed: the Wealth Tax Commission put a one-off 5 per cent tax on individual wealth above £500,000 at about £260 billion, and Zucman's G20 blueprint prices a 2 per cent minimum tax on the world's roughly 3,000 billionaires at 200 to 250 billion dollars a year globally. The honest caveats are real too: valuation is hard, annual versions raise far less than headlines suggest, and capital can move. My view is that a wealth tax is a financing tool, not a strategy. If the proceeds fund current spending, the balance sheet stays broken.
The second is rebuilding the asset side, and I think it is the anchor. Adopt public sector net worth as a formal fiscal target, so that selling an asset stops flattering the books and building one stops looking like pure cost. Scale the National Wealth Fund, capitalised at up to £27.8 billion since October 2024, toward a genuine sovereign vehicle with retained earnings and a Norwegian-style withdrawal rule. Rebuild the council housing stock, the largest and best-documented hole in the balance sheet, and stop selling what remains at a discount. This is slow. It is also the only route that directly recreates the wall.
The third is growth: planning reform, pension capital directed home, credible fiscal rules that bring the term premium down. Necessary, and insufficient. A bigger economy with a negative net worth is still a state without a wall.
The sequence I would argue for: anchor on the balance-sheet target, finance the first decade partly through a one-off levy at the very top earmarked by law for the fund rather than for day-to-day spending, and pursue growth as the enabler. Not nationalisation nostalgia, not a tax-and-spend reflex: an asset strategy, run over twenty years, judged by one number moving from minus £695.7 billion back towards zero.
The lesson for small states
The pattern is Western, not merely British: the World Inequality Report records net public wealth falling towards zero or below across the rich world since the 1970s. For small states the stakes are higher. A small open economy, Malta included, takes bigger shocks relative to its size, has no reserve currency, and has fewer tools when trouble arrives. That is precisely why the best-run small states, Norway and Singapore, are the ones that built sovereign buffers instead of selling them. The transferable lesson is not any particular tax. It is that public net worth is the quiet variable that decides whether a state can protect its families when the shock comes, and that it is far easier never to sell the wall than to rebuild it.
Britain is the cautionary tale: a country that ran a great national car-boot sale for forty years, spent the proceeds, and now pays close to £100 billion a year for the privilege of having owned things once. The rebuilding will take a generation whenever it starts. The only truly bad option is the current one, which is to keep pretending the wall is still there.
Questions readers ask
Why are UK taxes at a record high while public services get worse? Because the state's balance sheet flipped. In 1970 UK net public wealth was worth about a quarter of national income; by March 2026 public sector net worth stood at minus 695.7 billion pounds on the ONS measure. A government that no longer owns its assets rents them back and pays interest on its debts, 97.6 billion pounds in 2025-26 alone, so a growing share of tax revenue services the past instead of buying services. Record taxes and worse services are the same fact seen from two sides.
What happened to UK government wealth? It was sold and borrowed away over four decades. Right to Buy sold 1.9 million council homes in England for 104 billion pounds in 2024 money; those homes are now worth about 430 billion pounds, and an estimated 41 per cent are owned by private landlords. The entire 1970 to 2014 privatisation programme raised about 73 billion pounds in nominal terms, less than one year's current debt interest. Meanwhile household wealth rose from about three times GDP in the 1980s to a peak of eight times in 2021, driven mostly by passive capital gains.
Would a wealth tax fix the UK's public finances? On its own, no. The Wealth Tax Commission costed a one-off 5 per cent tax on individual wealth above 500,000 pounds at about 260 billion pounds, and Gabriel Zucman's G20 blueprint prices a 2 per cent minimum tax on the world's roughly 3,000 billionaires at 200 to 250 billion dollars a year. Those are financing tools. Unless the proceeds rebuild public assets rather than fund current spending, the balance sheet stays broken and the next shock is met with borrowing again.
How do Norway and Singapore handle economic shocks differently from the UK? They draw on assets instead of borrowing. Singapore took about 40 billion Singapore dollars from its past reserves to fund its COVID response, and investment returns fund about a fifth of its budget every year. Norway's sovereign fund passed 20,000 billion kroner in 2024. Britain funded furlough and the Energy Price Guarantee entirely with debt and now pays interest at 30-year gilt yields last seen in 1998.
Sources: ONS, public sector finances, March 2026 (net worth, net debt, debt interest); OBR, debt interest forecast and ready reckoners; OBR, the UK's tax burden in context; IFS, public sector net worth as a fiscal target; World Inequality Report 2018, part III; Resolution Foundation, Wealth Check (2024); Commons Library, household wealth statistics (note: the ONS wealth survey lost its official accreditation in June 2025, so distribution figures are best estimates); Commons Library, Privatisation (RP14-61); Common Wealth, Wrong to Sell (2024); Wealth Tax Commission final report (2020); Zucman, G20 blueprint (2024); Norges Bank Investment Management; Singapore Ministry of Finance, reserves; National Wealth Fund; Bloomberg, 30-year gilt yield highest since 1998 (May 2026). All figures are official estimates and subject to revision.